Table of Contents
This post may contain affiliate links. As an Amazon Associate we earn from qualifying purchases.
Hey all! January was only the third complete month for The Yum Yum Club and I’m proud to announce that revenue is up… again! ????
Yep, where December 2018 revenue was £5.36, in January 2019 revenue was a princely sum of £8.86!! Now, I do need to qualify this. Its true revenue is up again but it is still not covering expenses. Or even close to…
You’ll remember from the December Business Report that since opening its doors The Yum Yum Club had made a loss of £1,904.82, including the full write off of annual platform memberships, e.g. Bluehost.
The January £8.86 is obviously a positive contribution to the carry forward loss but there have been £511.77 expenses in January making the full year to date loss (end January 2019) at £2,407.73
The full January income and expenditure report are as follows:
Income
- Google Adsense – £7.99
- Media.net – $1.12 (£0.87)
- Affiliate Programs $0.00
- Amazon £0.00
- TOTAL £8.86
Expenditure
- Ingredients – £345.77
- Utensils – £166.00
- TOTAL – £511.77
On the face of it, having a net loss of £2,407.73 is not great but I need to keep this in perspective. This is the end of month 3 only and revenue is increasing. Plus, I’m eating some great food.
If you remember the November report you’ll know that the key to monetizing any blog is to have a constant and increasing flow of quality traffic to the blog. January showed some good growth compared to December…
1. Traffic growth over the first full quarter
Looking at the quarter (Nov – Jan) as a whole you can see that general traffic has increased:
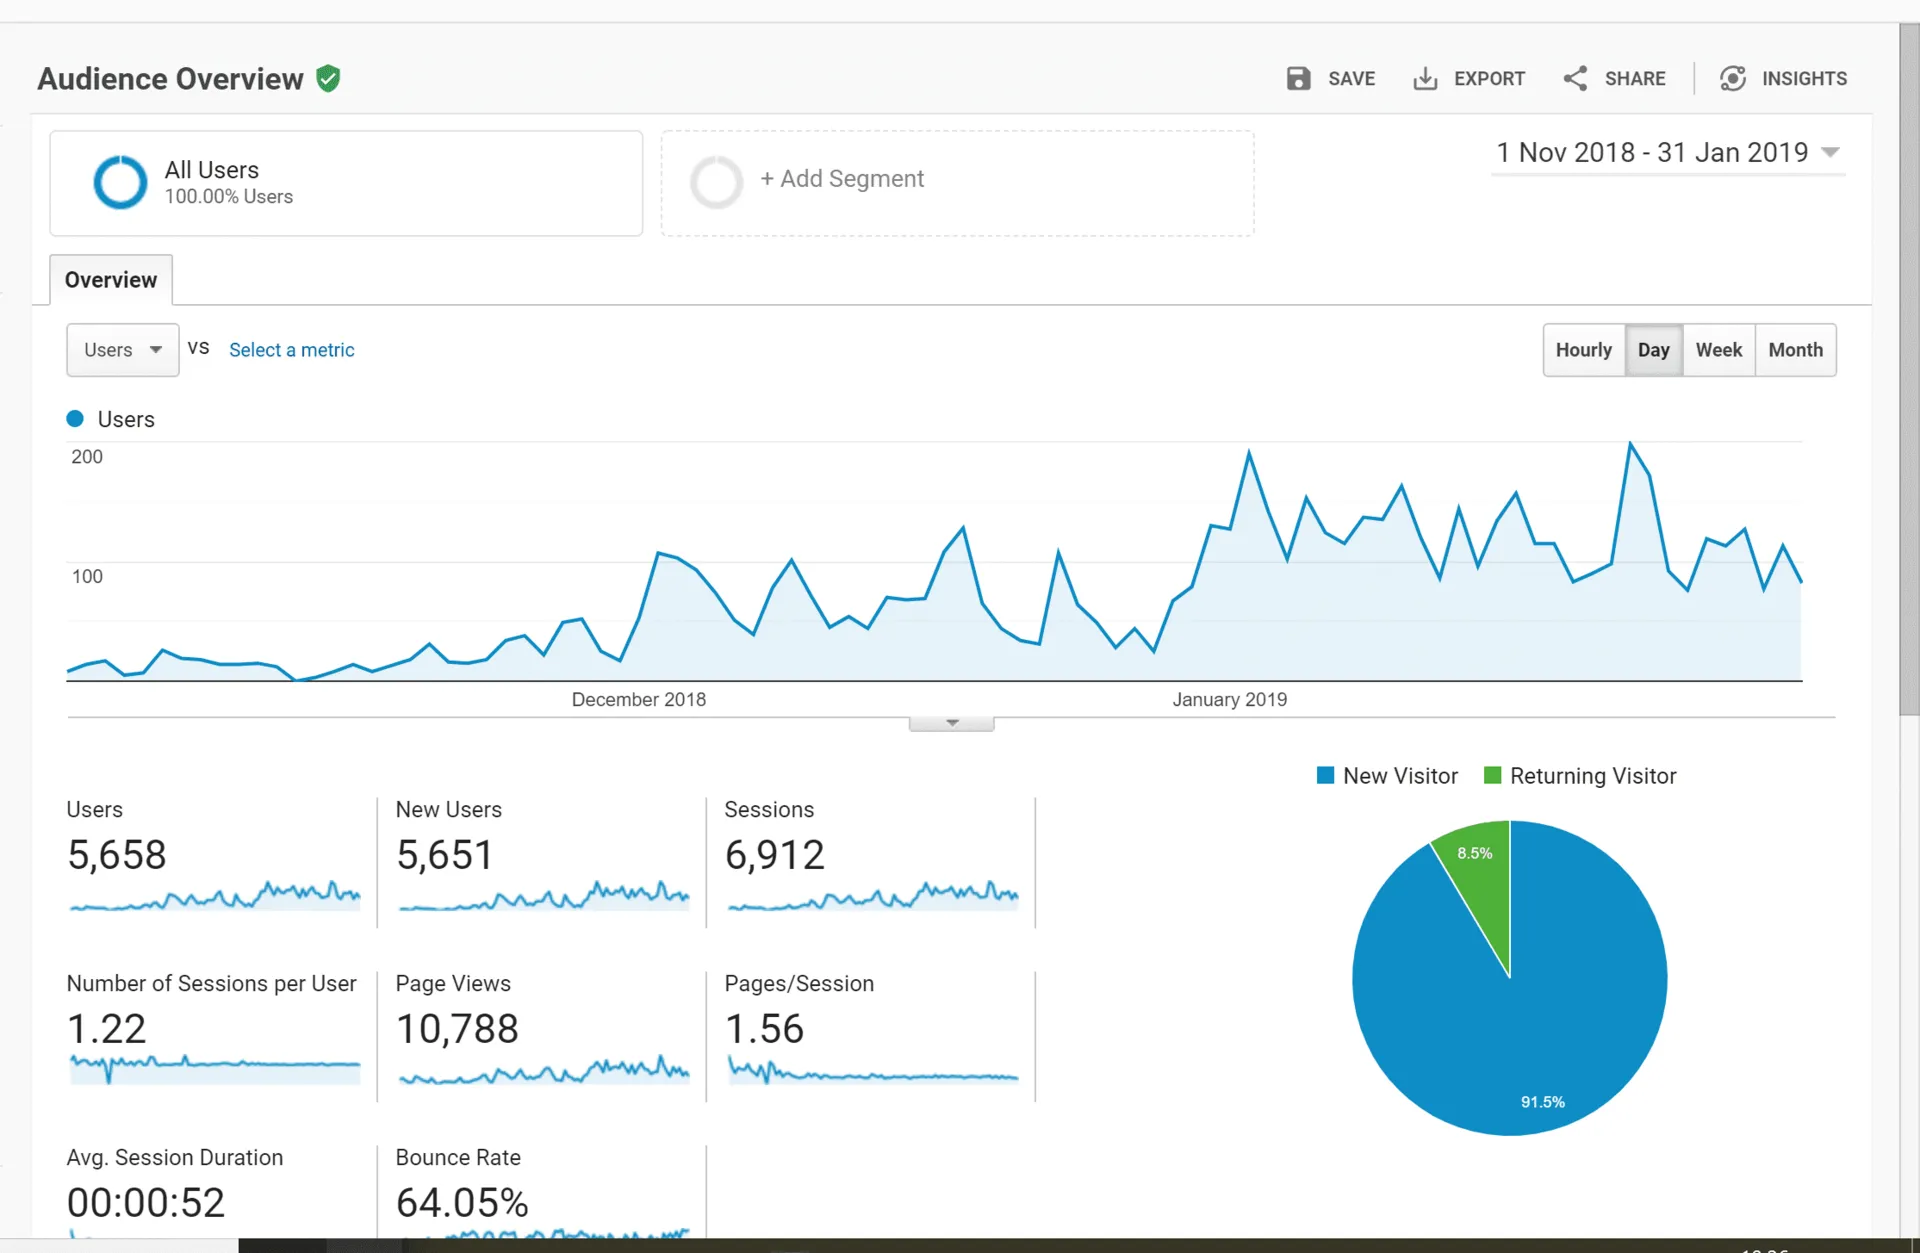
Overview of Q1 traffic
A clear steady trend upwards with 2 days in January almost hitting 200 unique visits per day.
Looking a little bit close at the detail, and with reference to the December numbers of 1,894 unique users, of which 1,847 were new, and 2,277 separate sessions viewing a total of 3,405 pages in total, it is clear that January has increased a great deal:
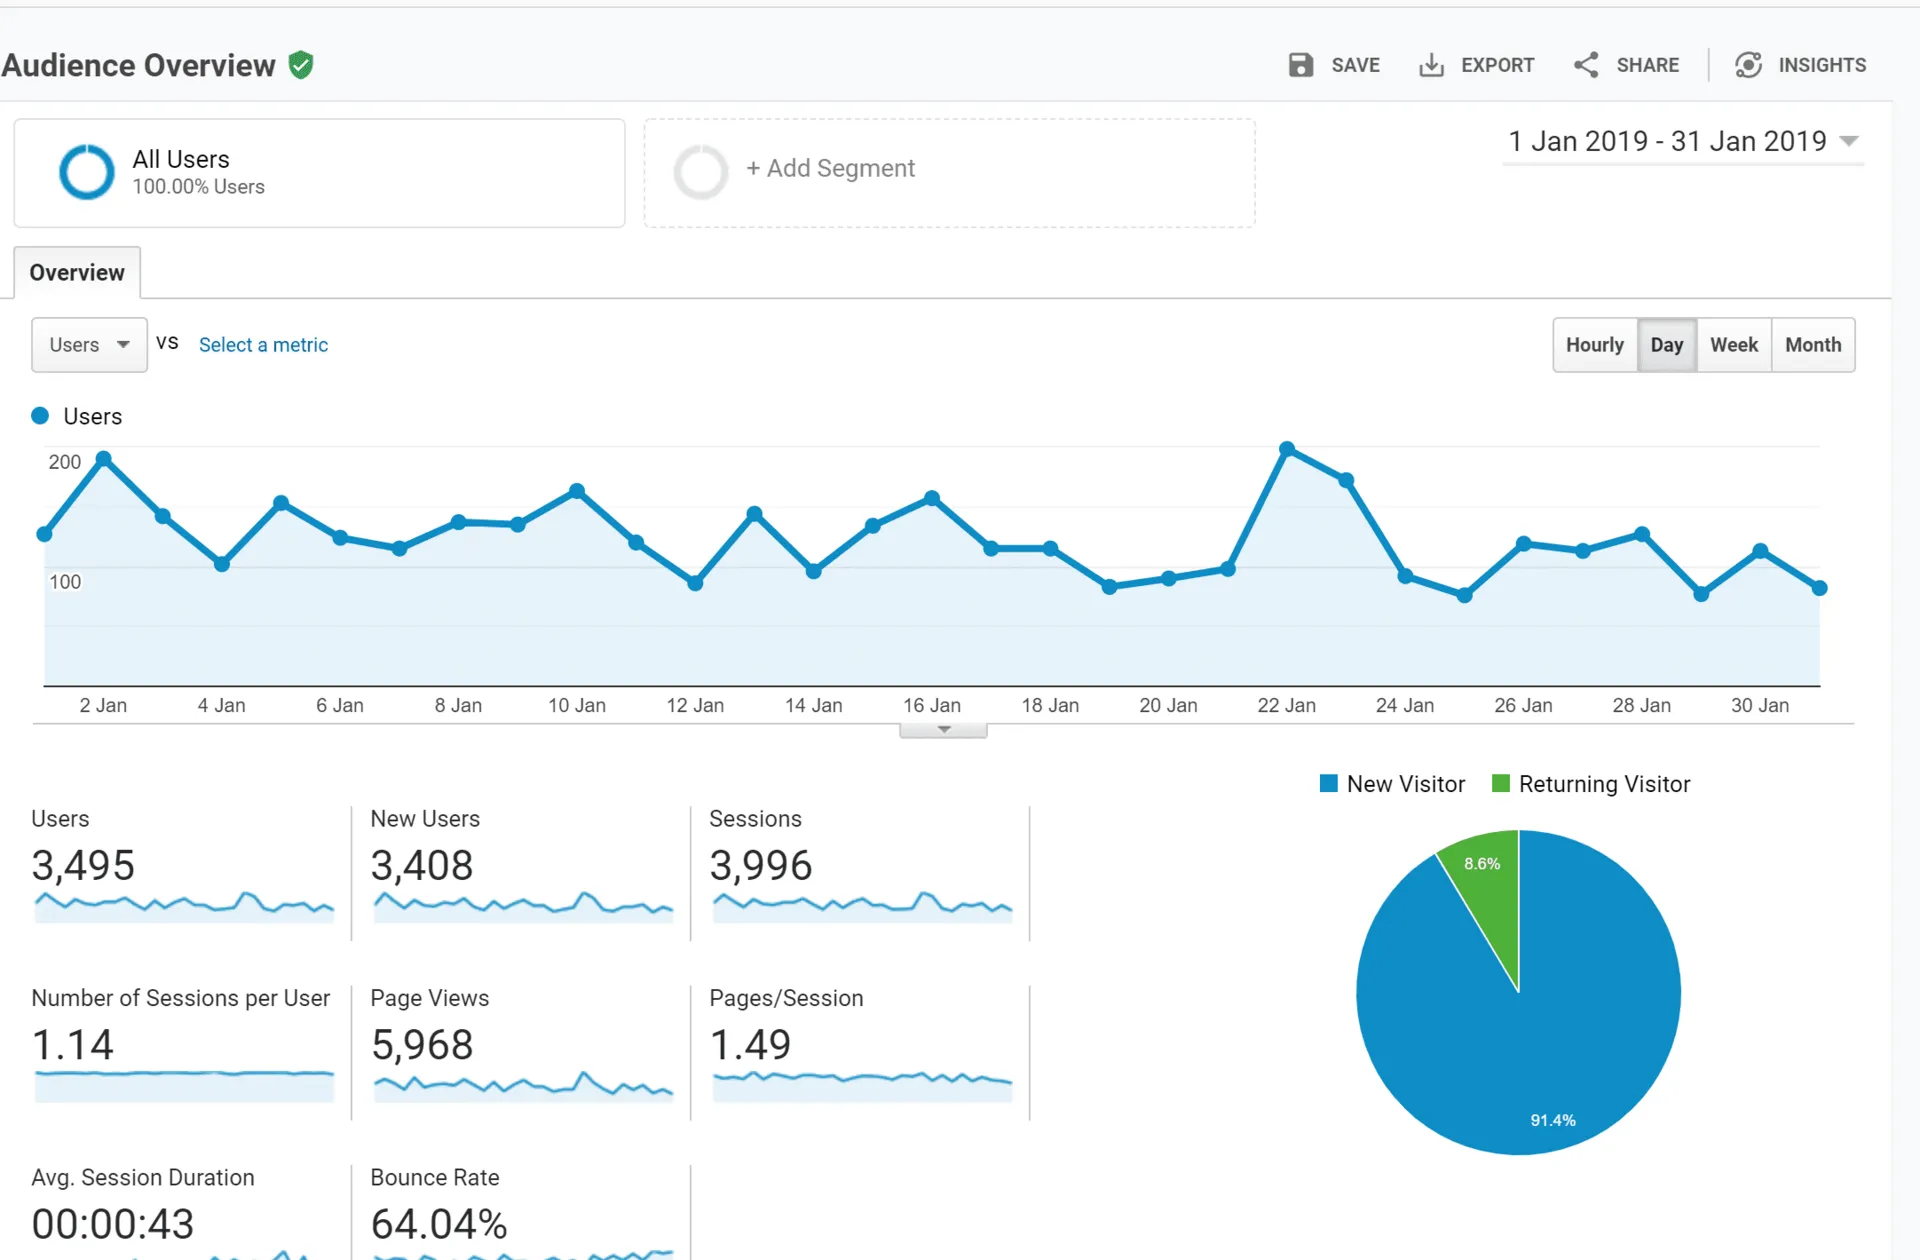
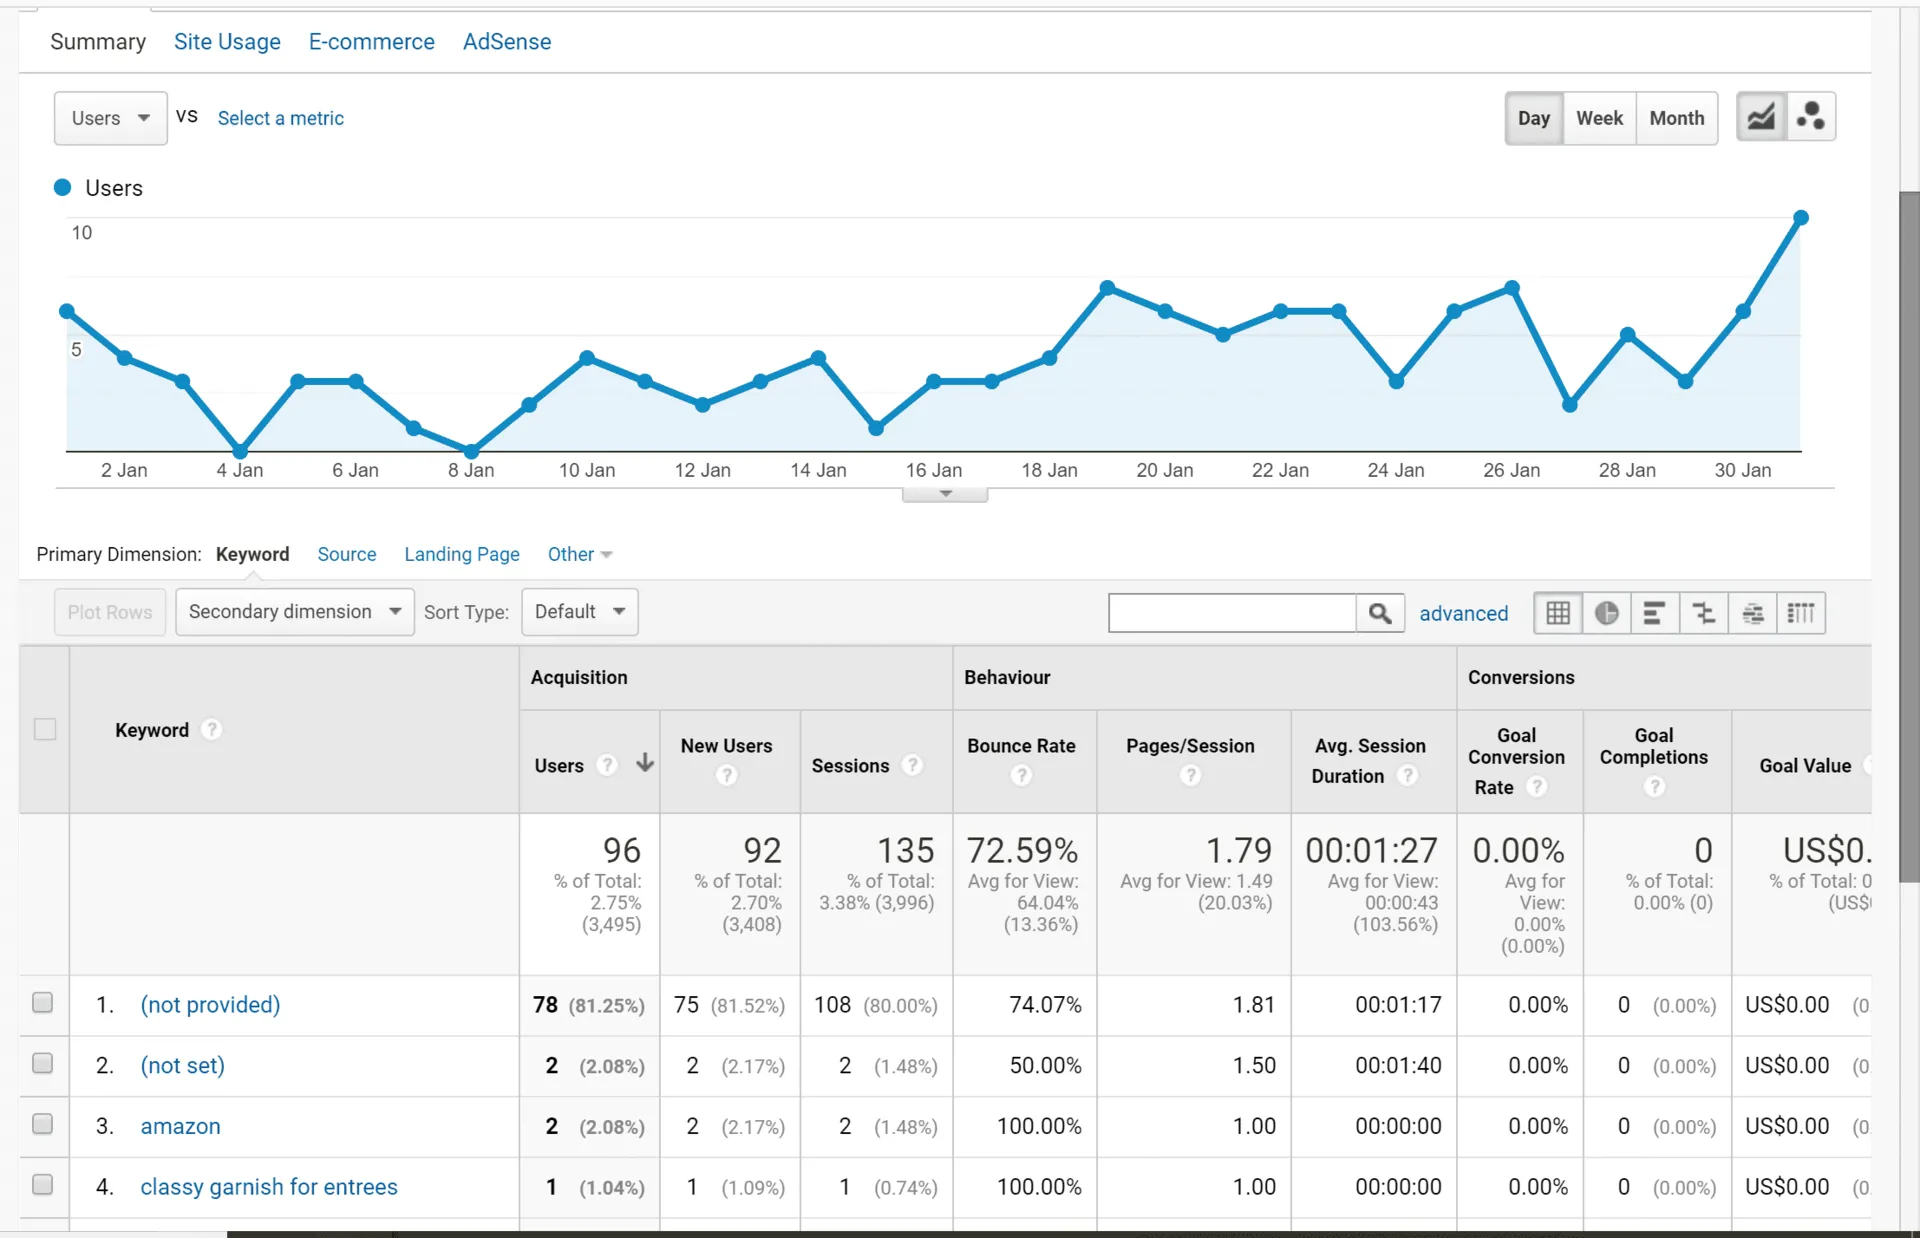
January 2019 traffic overview
These numbers show a January from December increase of 85% in individual users, 75% increase in the number of sessions and page views respectively. This sort of matches the 65% increase in revenue. Overall, a good increase.
But where is the traffic, and specifically the increase coming from?
2. Sources of traffic
You’ll remember from the previous report that traffic has been seen from, primarily, 4 different sources, namely, referrals (food submission sites), social, direct and organic. The goal for January was to continue to submit to the food sites and enhance the social traffic through the additional focus on Facebook. Overall traffic sources for January can be seen below:
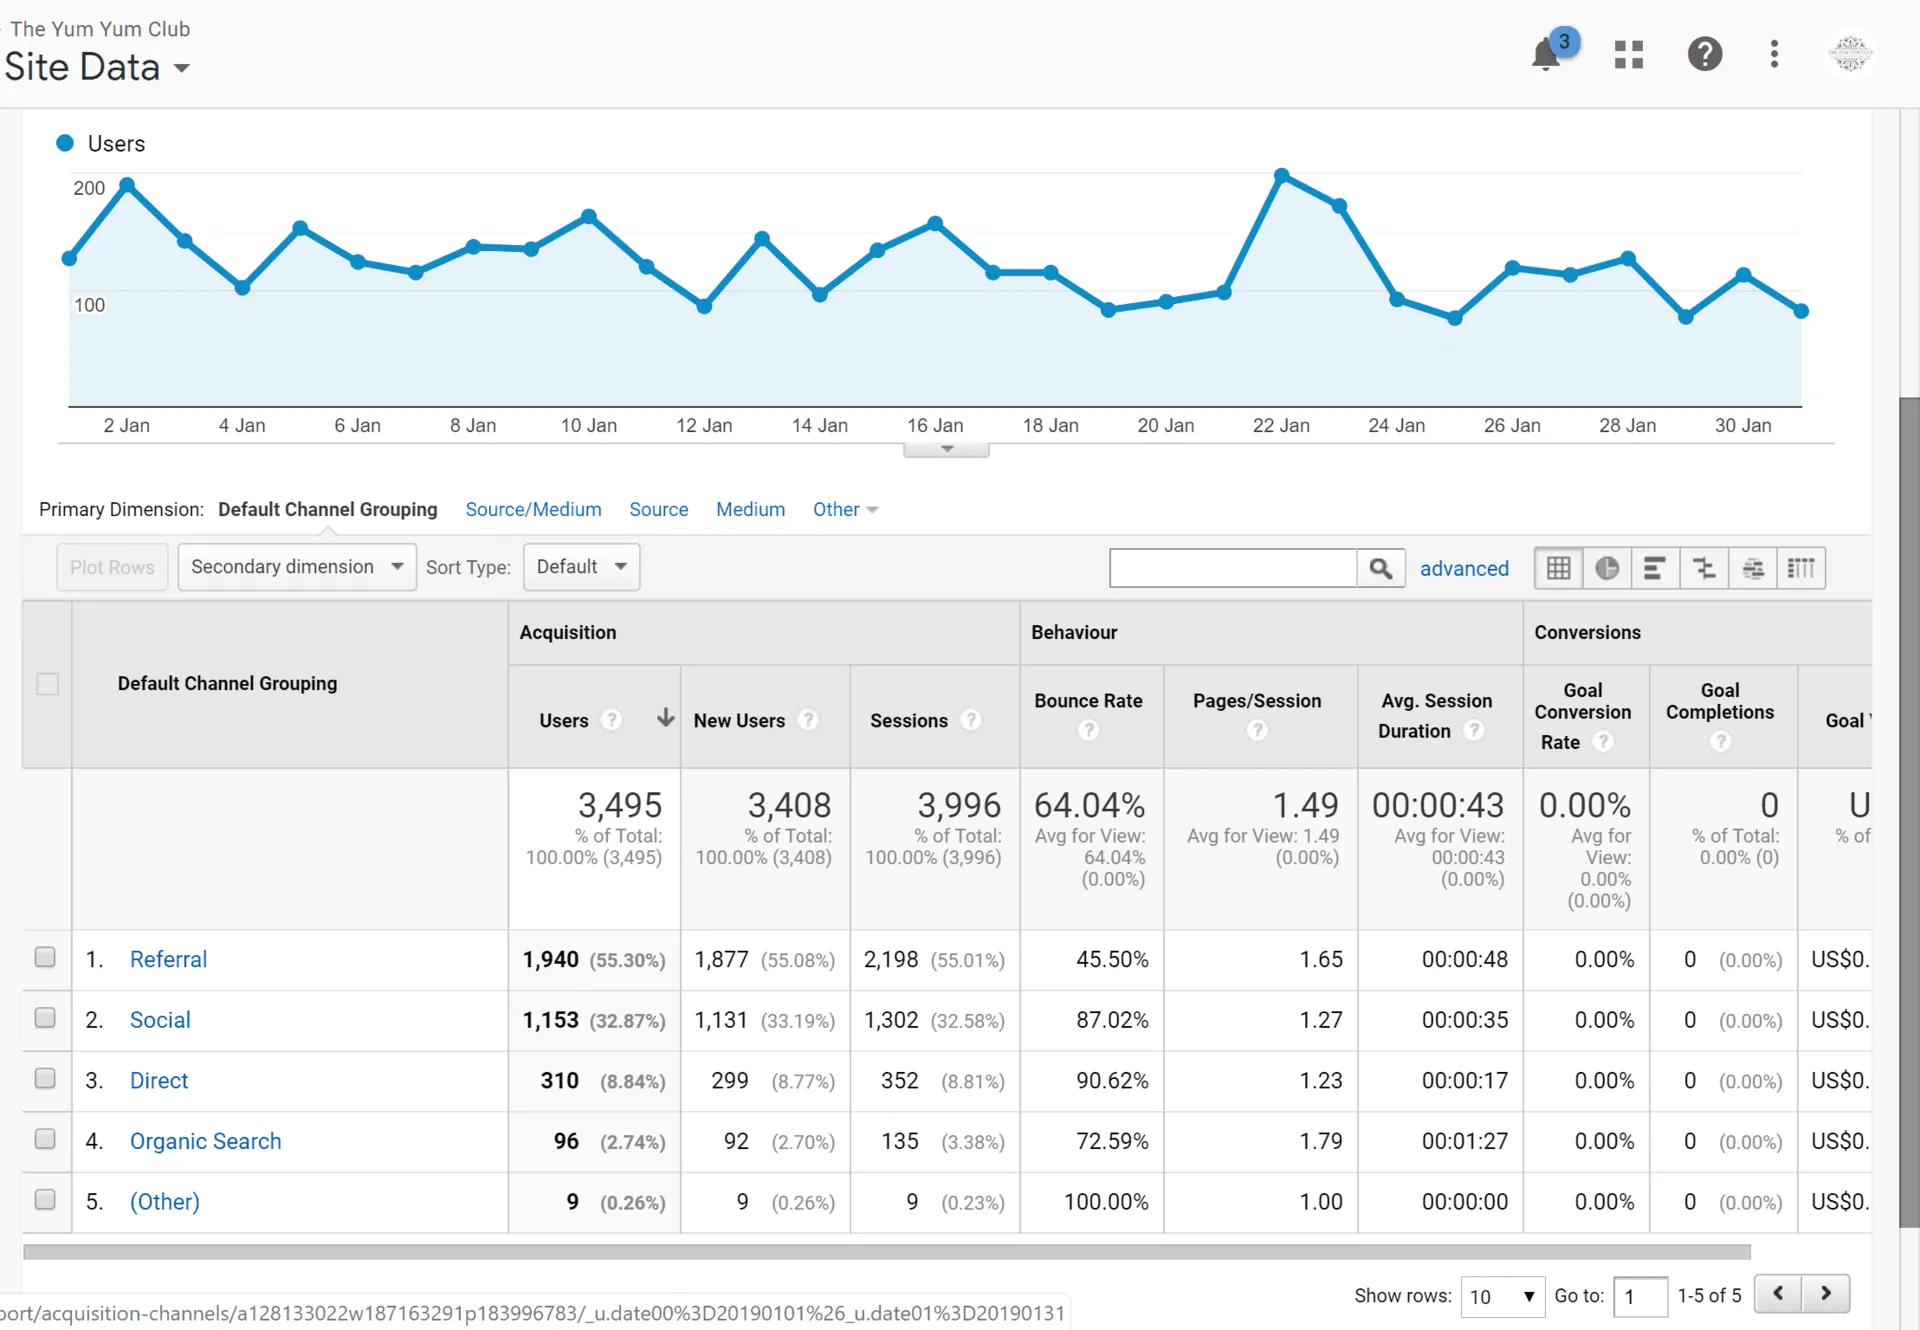
Sources of traffic – January 2019
As you can see, 55% of traffic came from referrals, 33% from social, 9% direct and 3% organic. The equivalent numbers for December were 70%, 19%, 7% and 4% respectively. This suggests my focus on the social side of traffic has worked. Let’s look at each source individually.
3. Referral traffic
As a reminder, referral traffic for December 2018 was as follows:
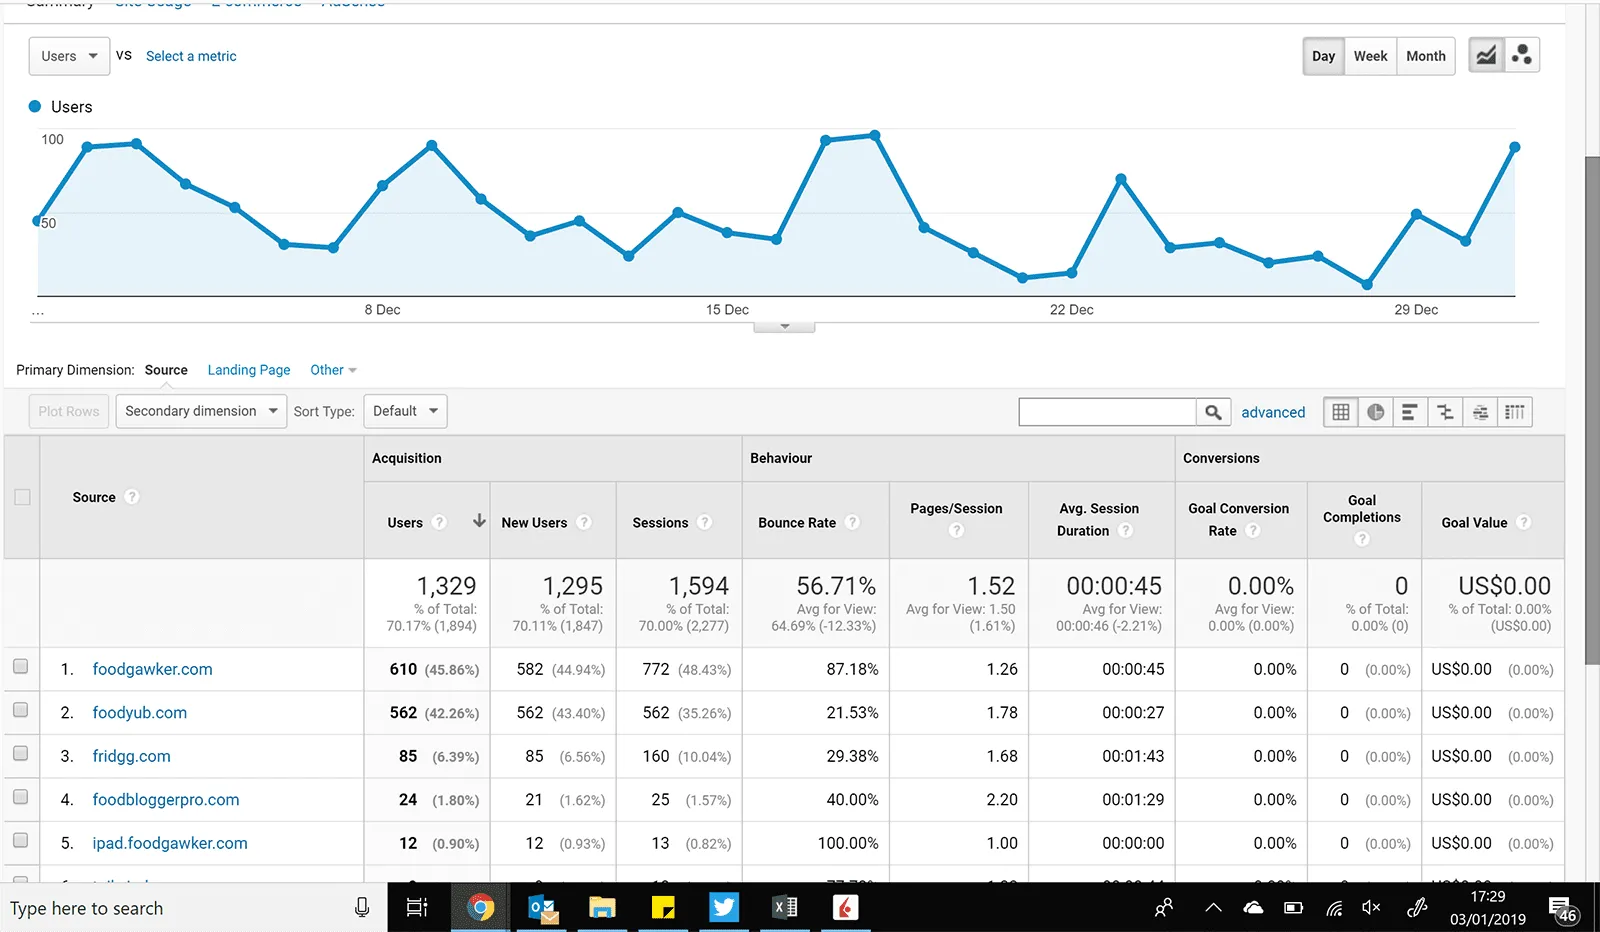
Referral traffic – December 2019
The equivalent for January 2019 is:
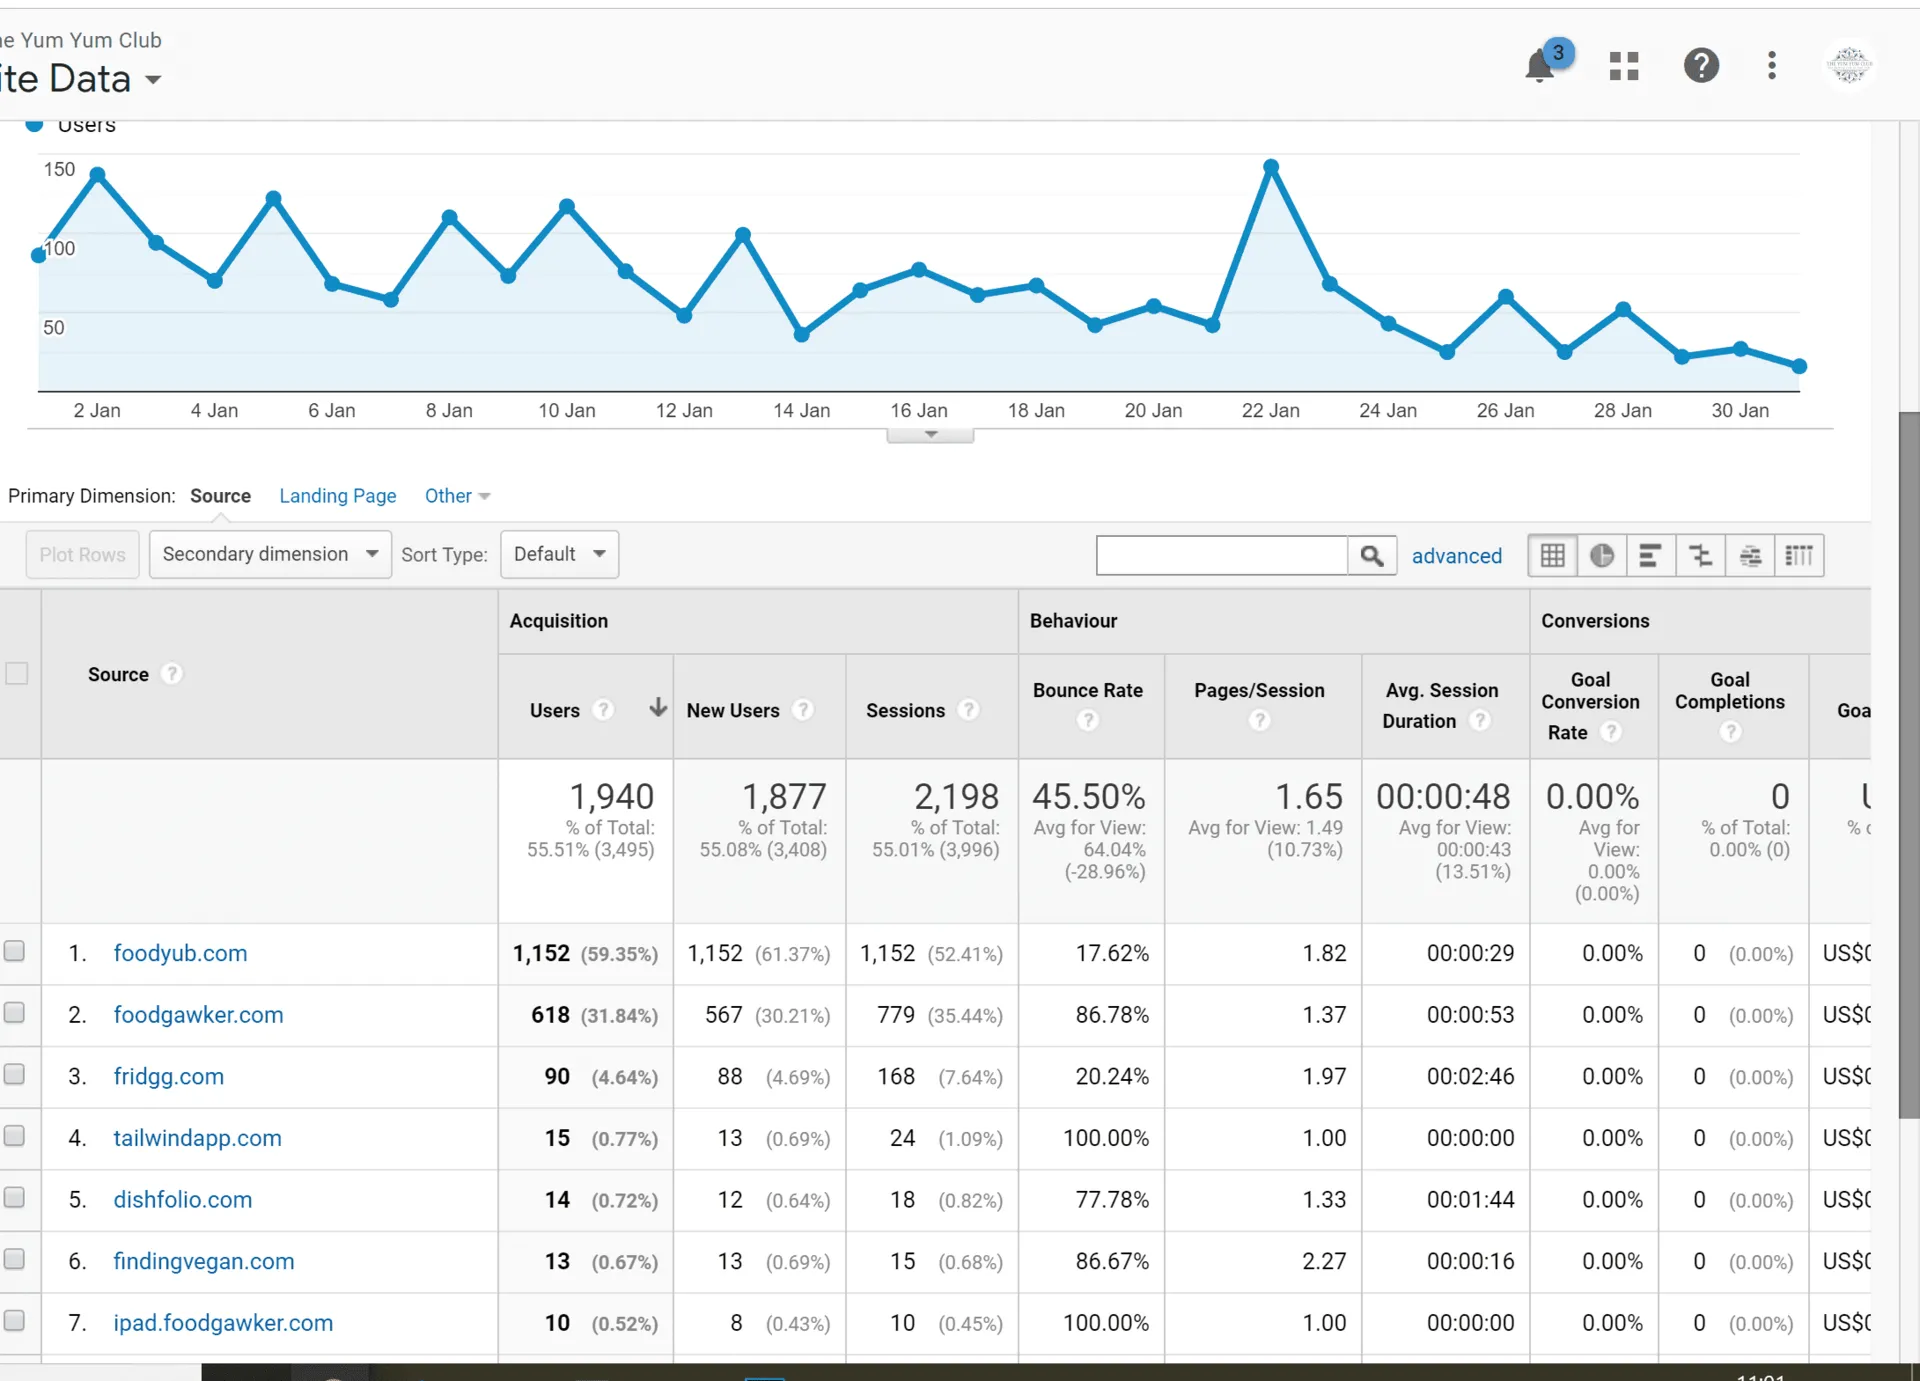
It’s clear that Foodgawker and Foodyub are still by far the big hitters. However, the top slot has swapped. The initial takeaway is that, although the publications timings from these sites seem to be random, they are still a good source of traffic. However, looking at the top graph you can see a reasonable reduction in traffic numbers from referrals as the month passed.
Looking back, I think the main reason for this is twofold. First, later through the month, my rate of submission was less (I wrote fewer posts) and, secondly, the quality of the photographs was less. This meant fewer photographs were actually accepted. I’m writing this January report late (19th February) and I see the same trend in February where I have been tied up with other things.
The obvious key takeaway for referrals (and all traffic, I guess) is to keep the momentum of the number of posts and make sure the photographs are top quality.
4. Social traffic
The social traffic for December was as follows:
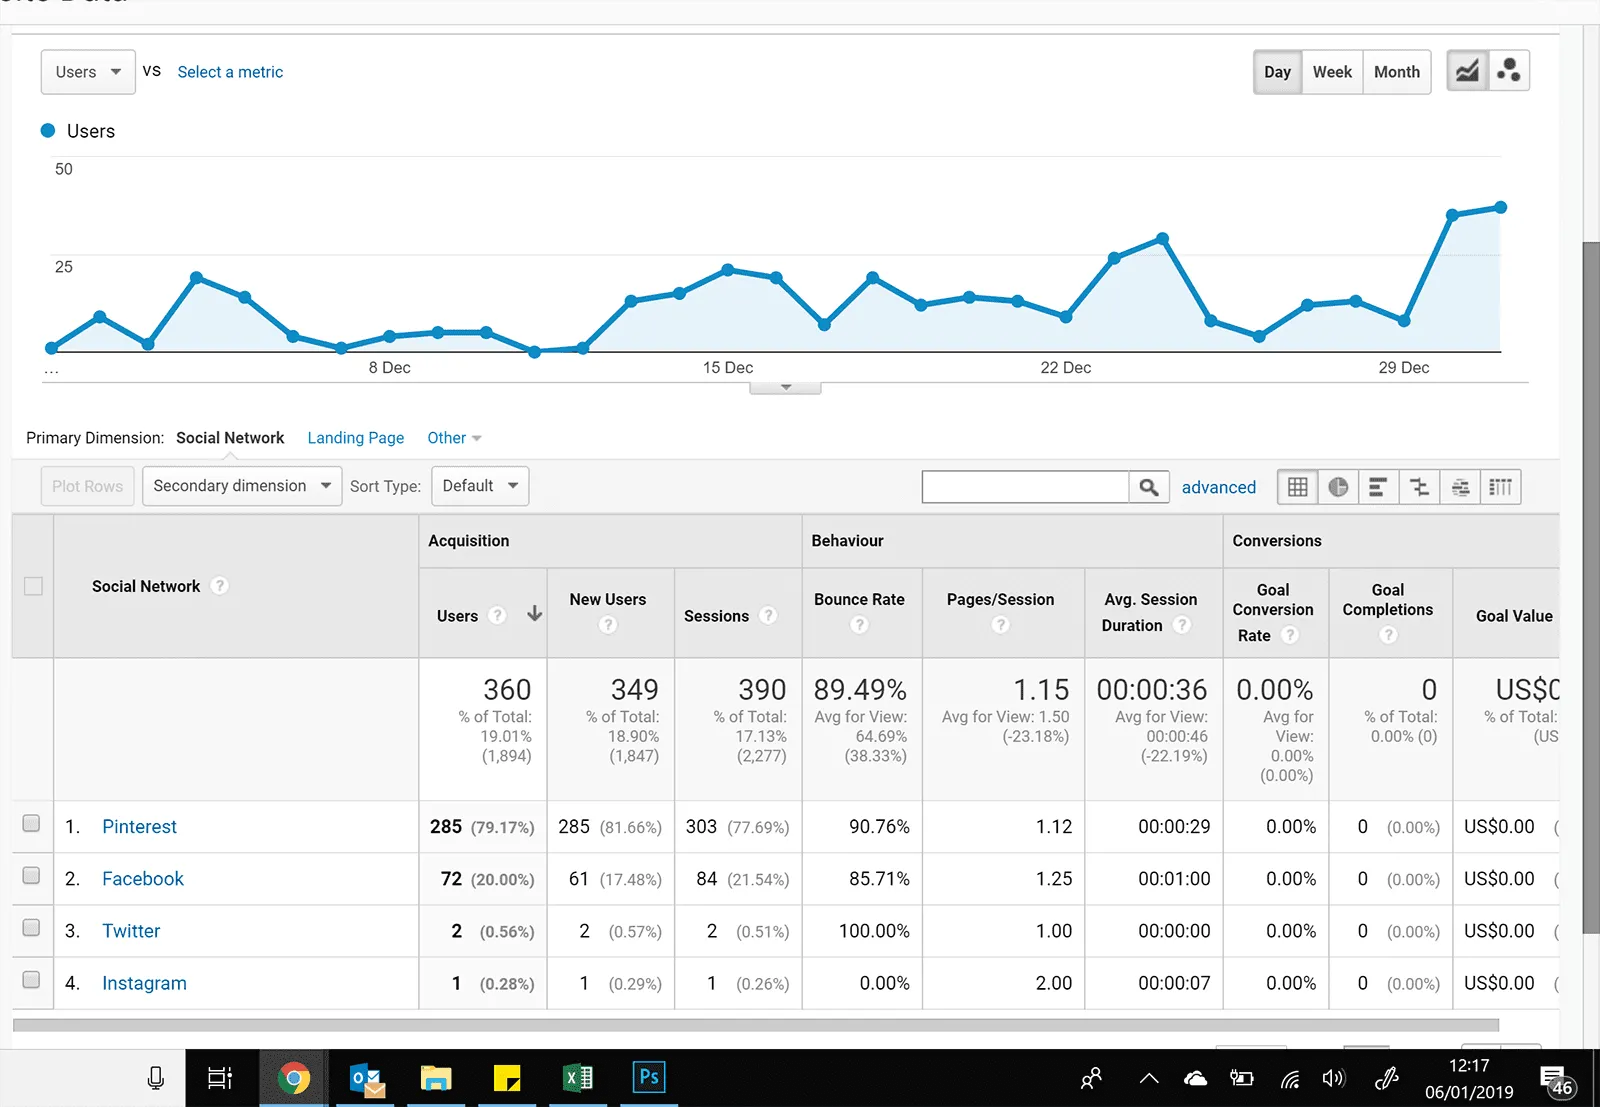
Social traffic – December 2018
It was all about Pinterest. I had focused on Pinterest and joined some groups. However, in January, although I continued focusing on Pinterest, joining more groups and tribes, I also focused on Facebook.
With Facebook I found a large number (over 50) recipe sharing pages and started to add any new recipe to these pages. This is what happened:
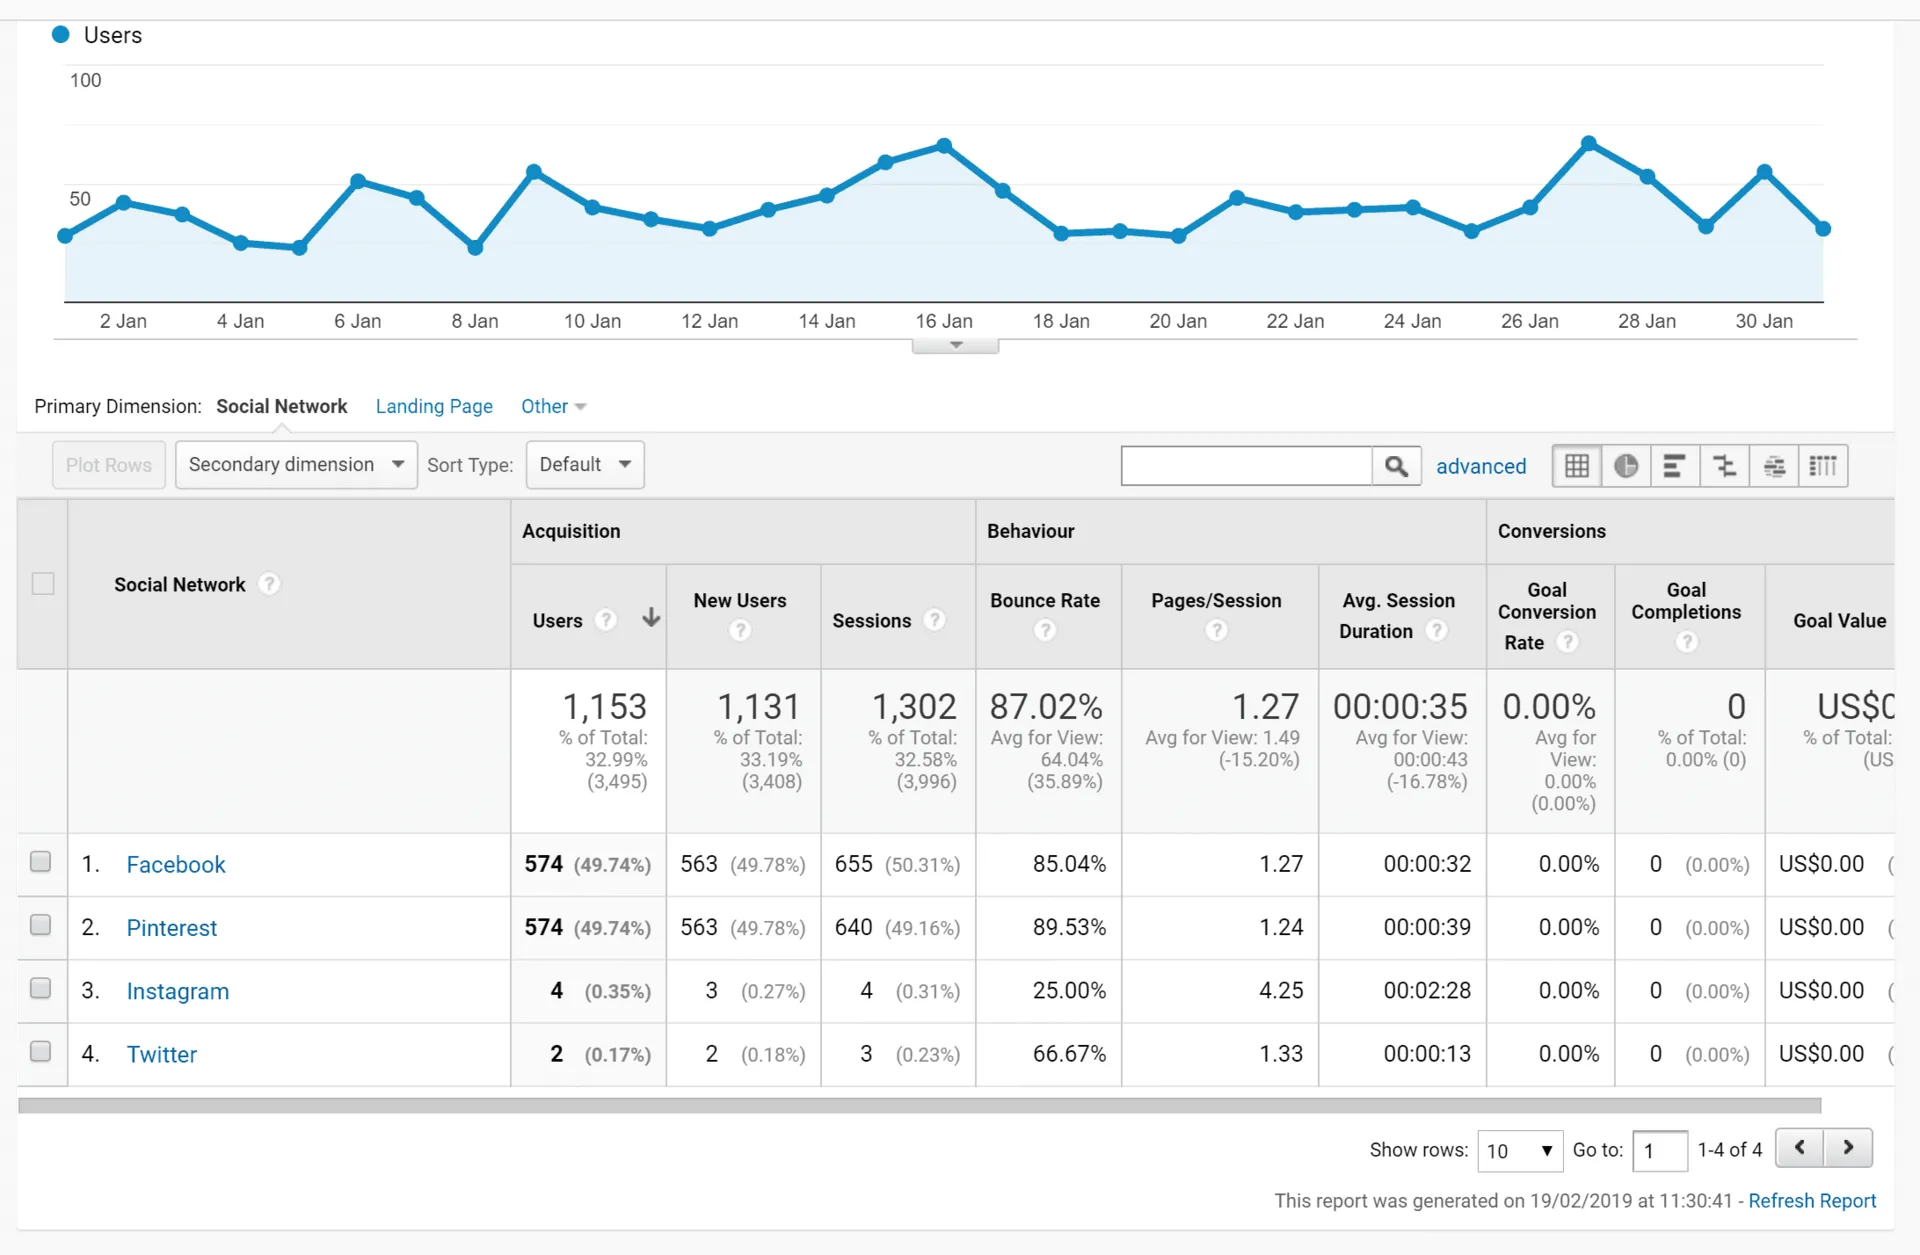
This is quite an amazing result. Compared to the 80% Pinterest 20% Facebook December split, with a little focus on Facebook, the split is now 50% / 50%.
The key takeaway here is to keep focusing on both. I need to keep growing both the number of groups and tribes on Pinterest and submission pages on Facebook.
5. Direct and organic traffic
Both direct and organic traffic in December was very small. In January, however, 310 and 896 respectively. Looking at direct traffic first it is clear there are a couple of anomalies:
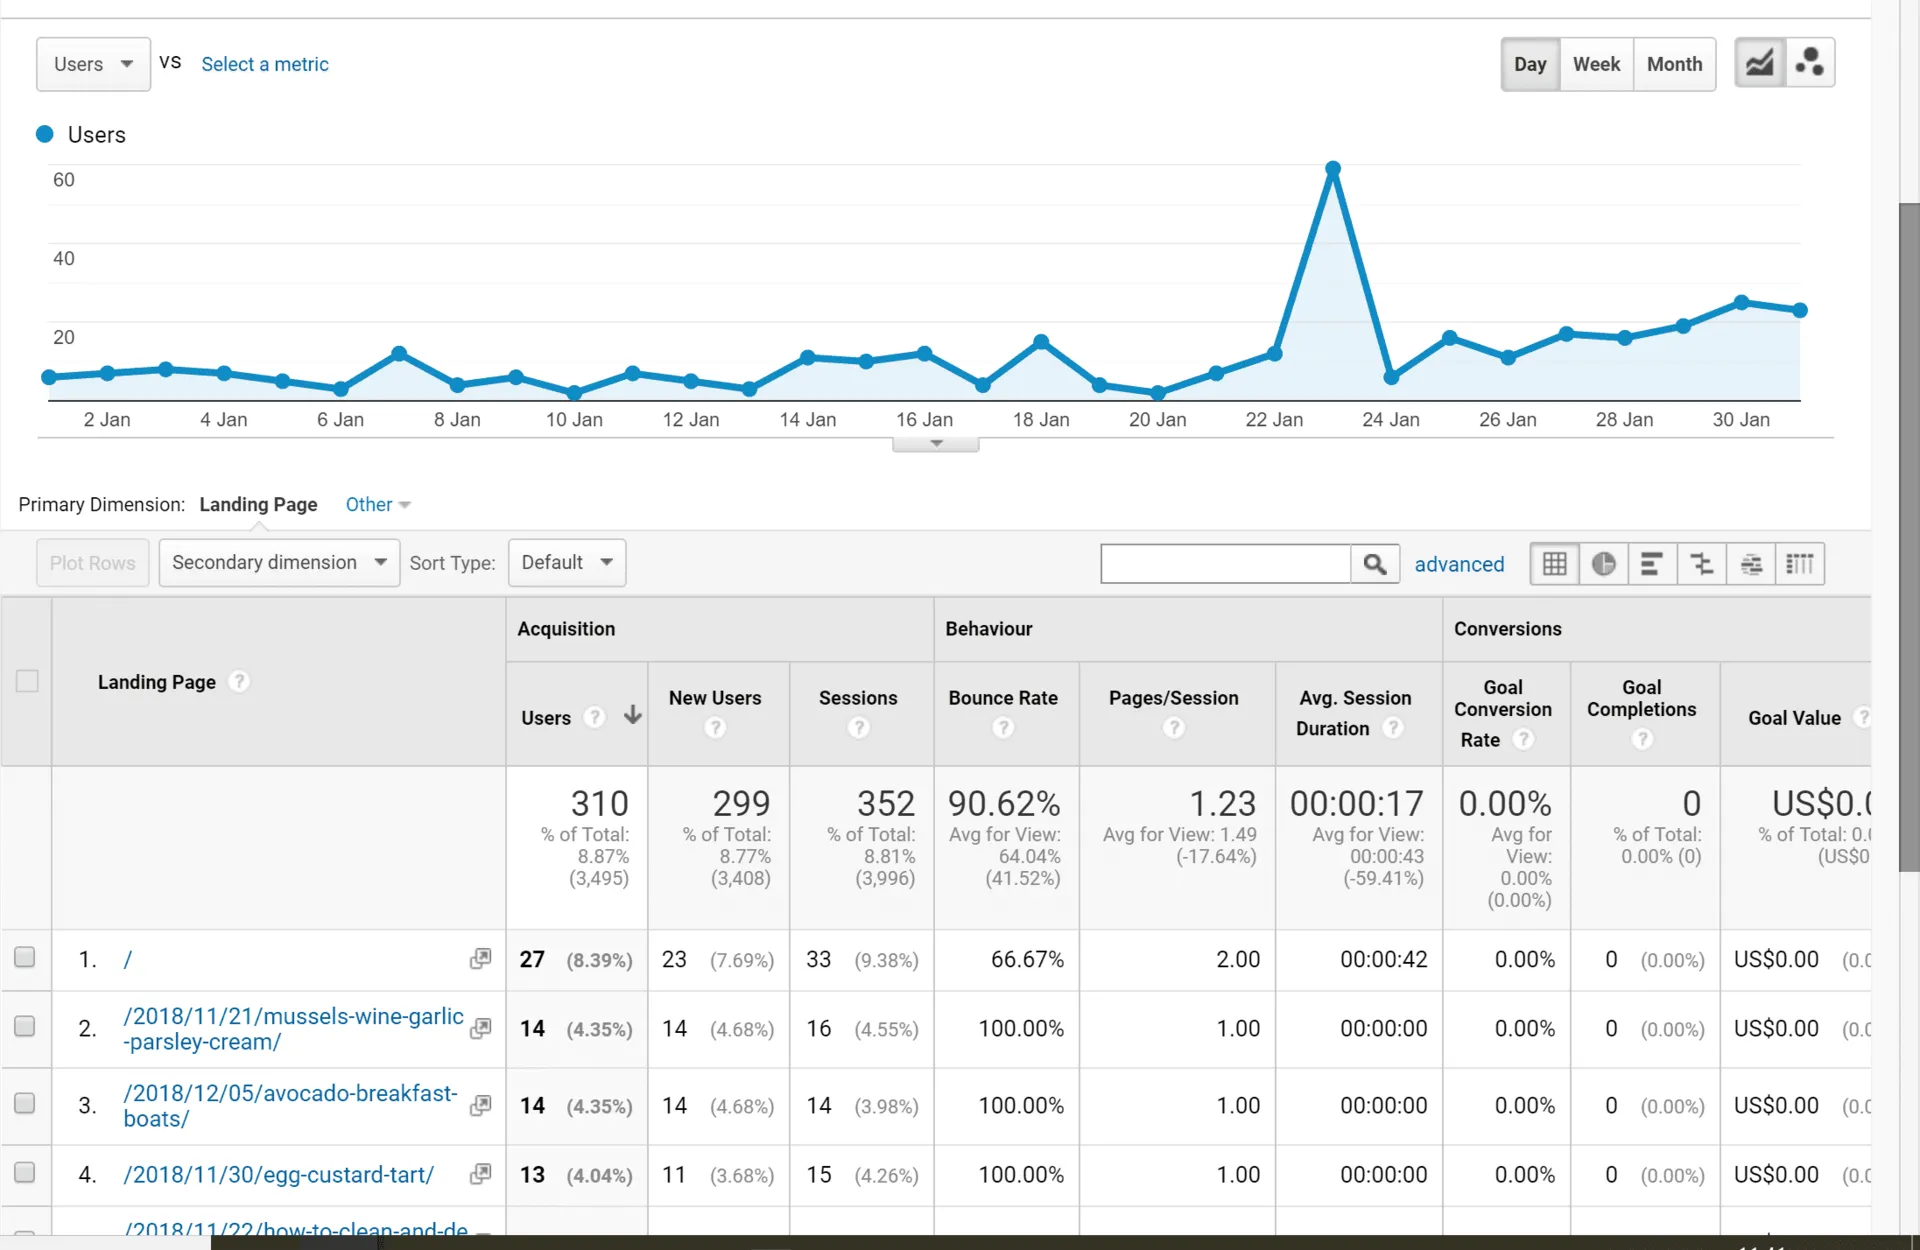
Direct traffic – January 2019
Although it is clear that direct links to theyumyumclub.com are increasing, which shows an increase is regular followers. There is an anomaly on 23rd January where there was a massive jump around midday from the same location. This proved to be a robot spammer which is now blocked.
Turning to organic traffic, which is more important than direct as this is a signal of how good the site’s SEO is, we can see a steady increase here too:
Organic traffic – January 2019
There is not a lot to say about this except keep it going and keep monitoring. Ultimately, organic traffic i.e. those who find the site by searching particular subjects in search engines, should be the majority of traffic the site receives. This, therefore, just needs to keep going up.
6. A couple of other points.
Back in December, I discussed 3 other points that I wanted to update you on, namely, advertising, affiliate programs and smoothies
a) Advertising
I won’t repeat what was said in December but as an update, I have now removed the secondary sidebar and stuck with just one. The second sidebar made the site seem cluttered and also detracted from the main content.
I have also moved away from Google Adsense auto ads and now place adds manually in the body of each post. I need to wait for February to end but I sense this will increase my $ per session, or equivalent KPI i.e. the side is becoming more efficient.
b) Affiliate programs
Being blunt, affiliate programs have done nothing for me yet. I have actually removed some now and replaced with advertising. I need to look at this more through February and March and plan a strategy as the traffic grows.
c) Smoothies
I have made and published 14 smoothies to date. They have been very popular and I’d like to get to 20 and then produce an ebook which I can use as an incentive to people to sign up to the newsletter.
7. February and March objectives
As mentioned above, I’m writing this January report in mid-February which means the February report will focus just on the numbers, which are not looking as good as January at the time of writing.
Therefore, the key tasks for the rest of February and March are as follows:
- Increase the momentum of posting from the slower early February rate. At least 5 per week.
- Improve the quality of the photographs. I have bought a light box so hopefully, this will help.
- Get to 50 Pinterest groups and tribes respectively.
- Achieve 100 Facebook recipes pages.
- Make at least 20 smoothies in total and try and complete the ebook.
OK, that’s it for the January 2018 Business Report. It was a busy month and The Yum Yum Club did generate £8.86 in revenue. Let’s see what the short month of February brings…
As always, thanks for reading and until next time…Steve.